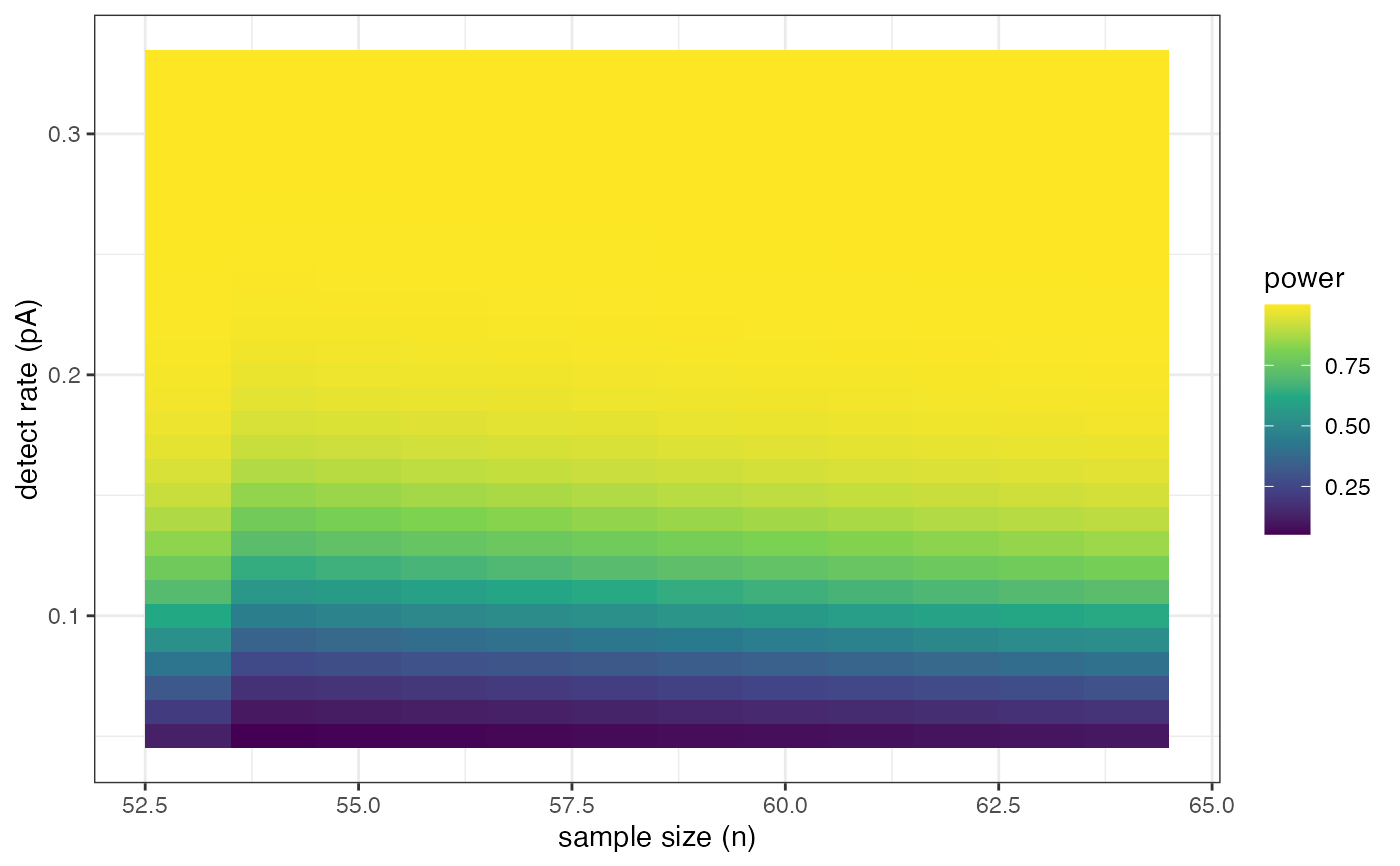
This function calculates a table of sample sizes for with an experiment, given a lineup size, and estimates of the detection rate.
sample_size(n = 53:64, m = 20, pA = seq(1/20, 1/3, 0.01), conf = 0.95)Arguments
- n
range of sample sizes to check, default is 53:64
- m
linup size, default 20
- pA
range of estimated detection rates to consider, default is seq(1/20, 1/3, 0.01)
- conf
confidence level to use to simulate from binomial
Examples
pow <- sample_size()
pow
#> # A tibble: 348 × 4
#>        n     k    pA   prob
#>    <int> <dbl> <dbl>  <dbl>
#>  1    53     5  0.05 0.125
#>  2    54     6  0.05 0.0520
#>  3    55     6  0.05 0.0560
#>  4    56     6  0.05 0.0602
#>  5    57     6  0.05 0.0646
#>  6    58     6  0.05 0.0691
#>  7    59     6  0.05 0.0738
#>  8    60     6  0.05 0.0787
#>  9    61     6  0.05 0.0838
#> 10    62     6  0.05 0.0891
#> # ℹ 338 more rows
library(ggplot2)
library(viridis)
#> Loading required package: viridisLite
ggplot(pow, aes(x=n, y=pA, fill=prob, group=pA)) +
  geom_tile() +
  scale_fill_viridis_c("power") +
  ylab("detect rate (pA)") + xlab("sample size (n)") +
  theme_bw()