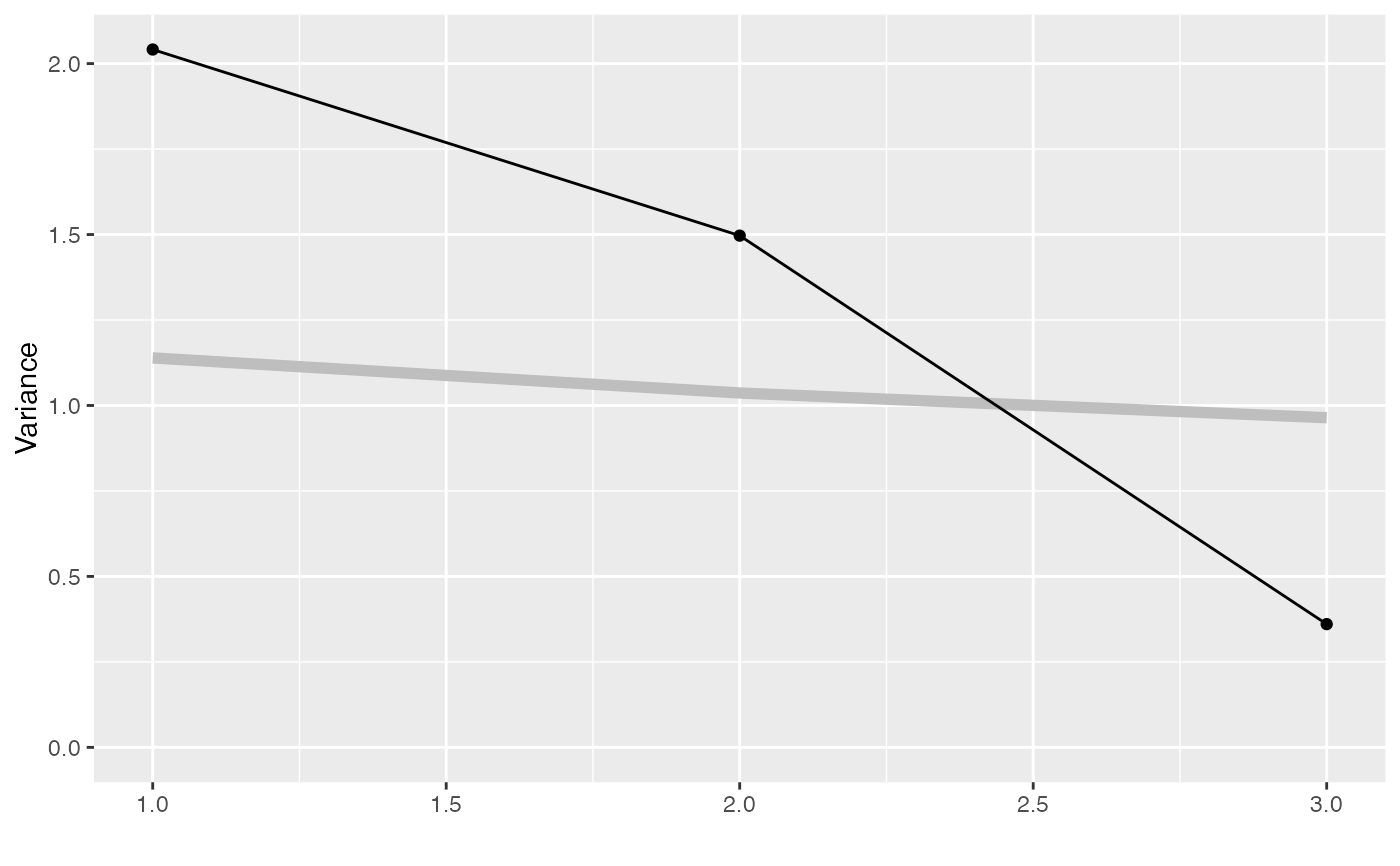
Takes a PCA object returned by prcomp(), extracts
the standard deviations of the principal components (PC), and
plots these against the PC number. The guidance line assumes that
all of the variables have been standardised prior to PCA.
Takes a PCA object returned by prcomp(), extracts
the standard deviations of the principal components (PC), and
plots these against the PC number. The guidance line assumes that
all of the variables have been standardised prior to PCA.