Takes data returned by mclustBIC(), converts to a tibble
for plotting.
Examples
require(mclust)
#> Loading required package: mclust
#> Package 'mclust' version 6.1.1
#> Type 'citation("mclust")' for citing this R package in publications.
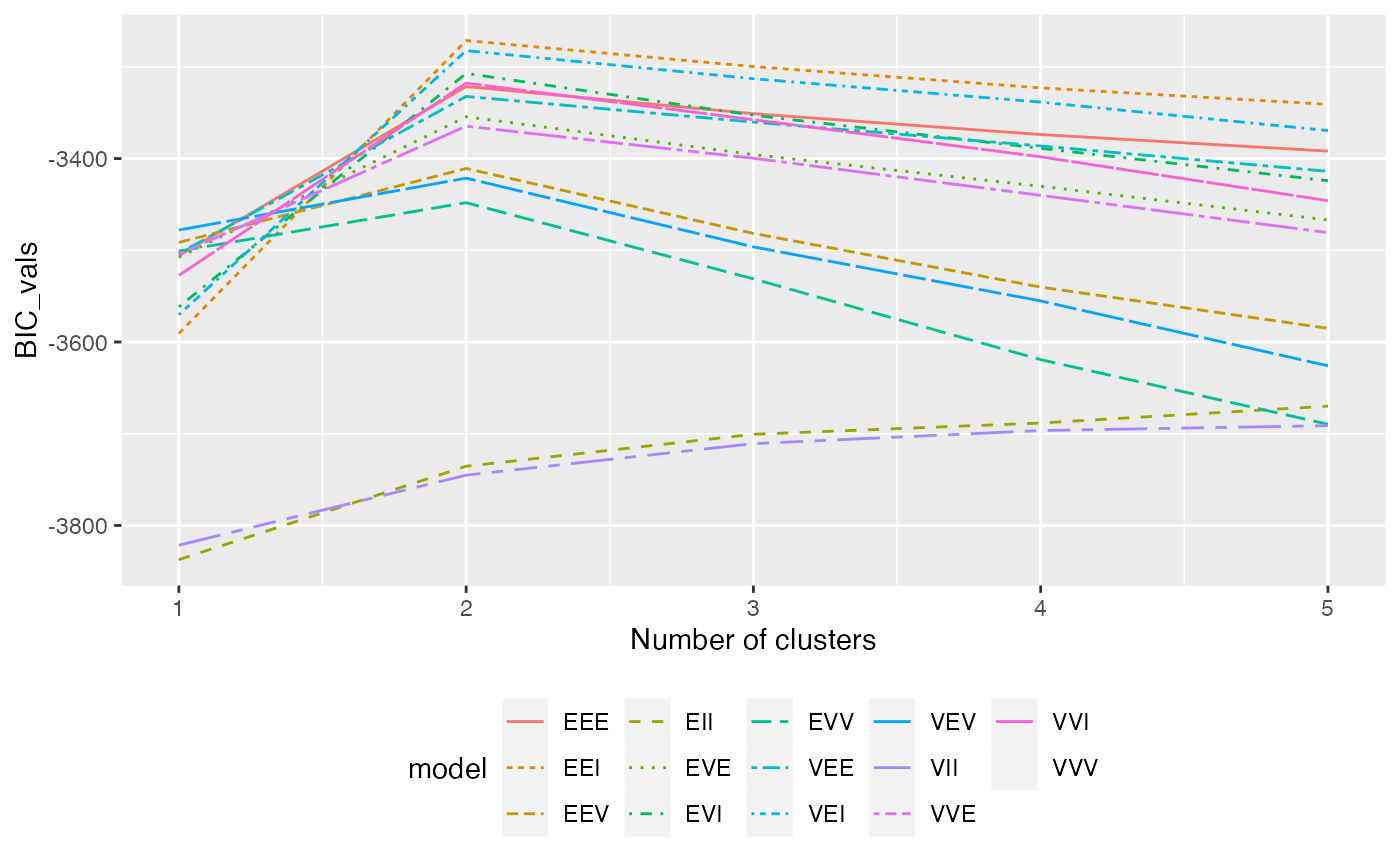
data(clusters)
clusters_BIC <- mclustBIC(clusters[,1:5], G=2:6)
ggmcbic(clusters_BIC)
#> Warning: This manual palette can handle a maximum of 13 values. You have supplied 14
#> Warning: Removed 5 rows containing missing values or values outside the scale range
#> (`geom_line()`).
 ggmcbic(clusters_BIC, top=4)
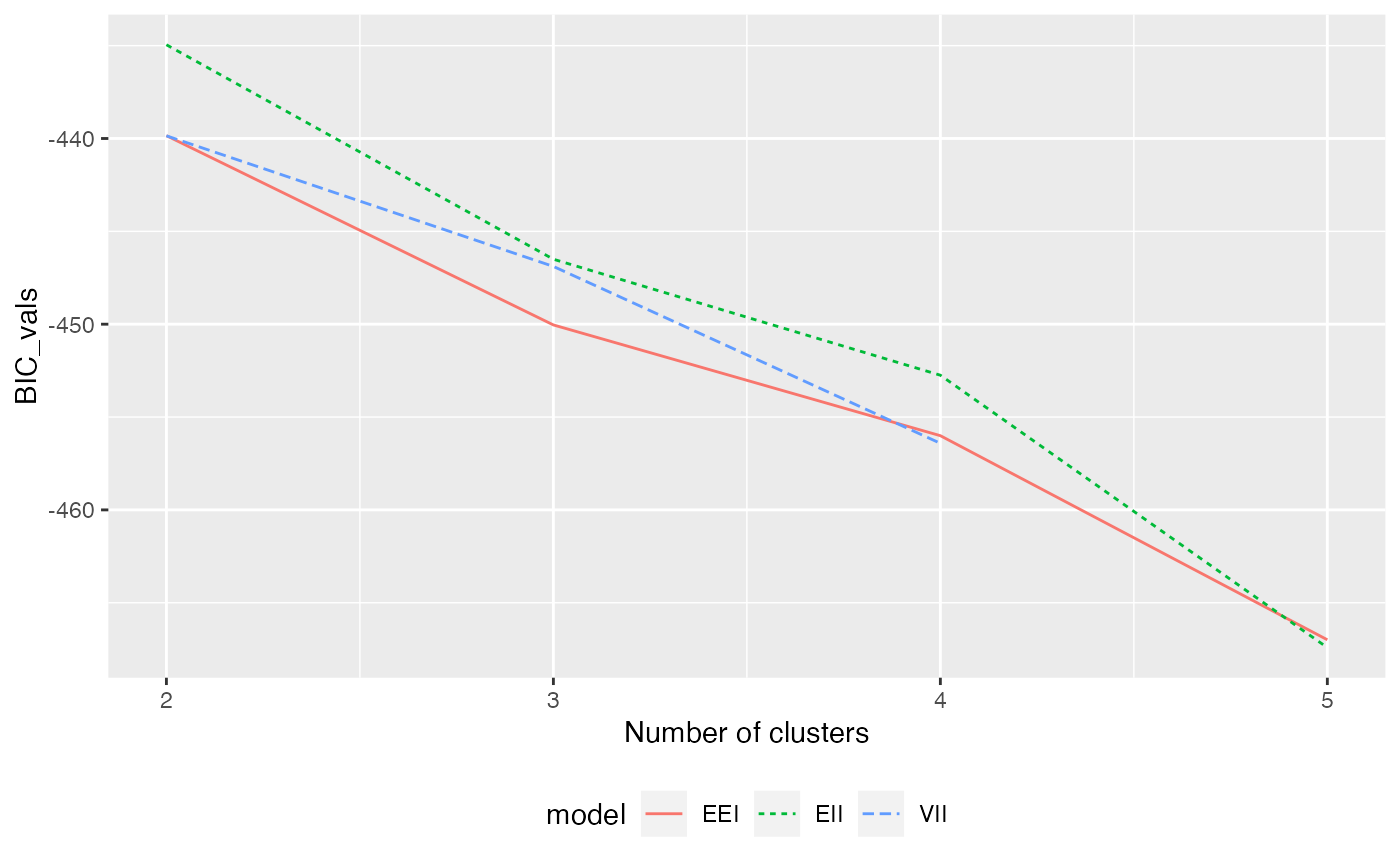
 data(simple_clusters)
clusters_BIC <- mclustBIC(simple_clusters[,1:2])
ggmcbic(clusters_BIC, cl=2:5, top=3)
#> Warning: Removed 1 row containing missing values or values outside the scale range
#> (`geom_line()`).
data(simple_clusters)
clusters_BIC <- mclustBIC(simple_clusters[,1:2])
ggmcbic(clusters_BIC, cl=2:5, top=3)
#> Warning: Removed 1 row containing missing values or values outside the scale range
#> (`geom_line()`).