R/data.R
clusters_nonlin.Rd
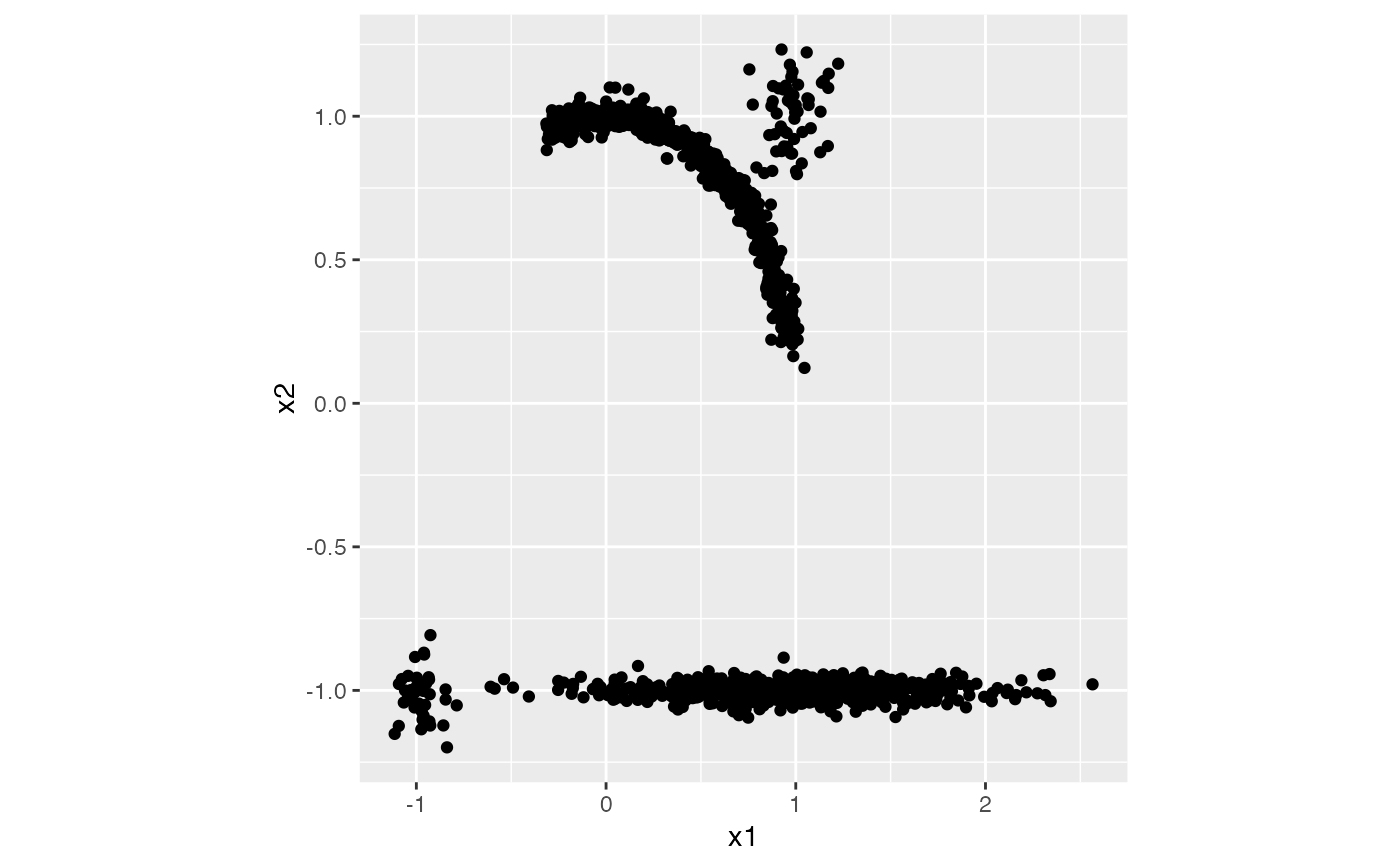
This data is simulated to use for testing. It has two small spherical clusters, and a curve cluster and a sine wave cluster.
A dataset with 300 rows and 6 columns
five numeric variables
clusters
require(ggplot2)
ggplot(clusters_nonlin, aes(x=x1, y=x2)) +
  geom_point() +
  theme(aspect.ratio=1)