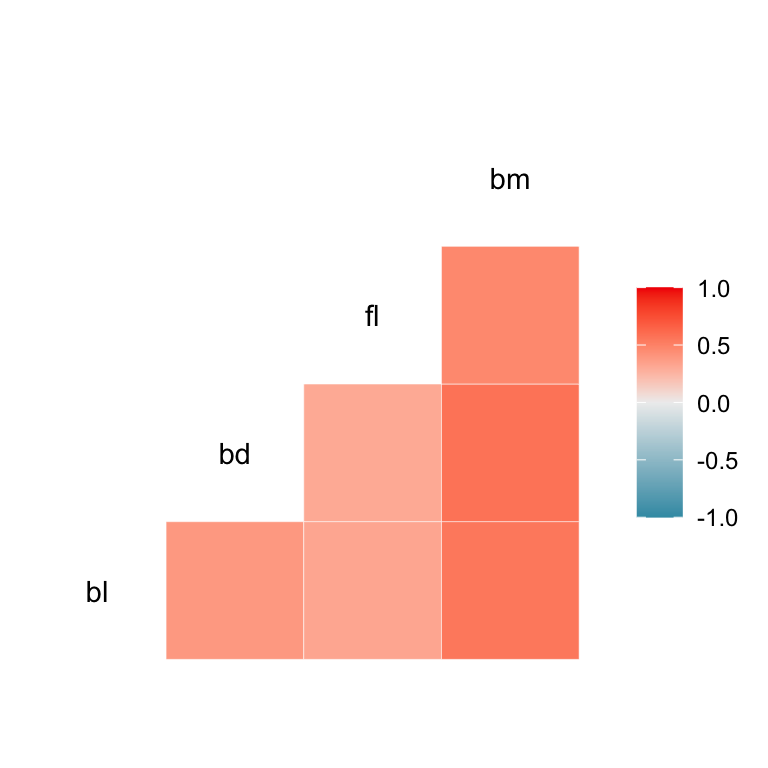
The corrgram package has numerous correlation display capabilities.
Large sample size
# Data downloaded from https://archive.ics.uci.edu/dataset/401/gene+expression+cancer+rna+seq# This chunk takes some time to run, so evaluated off-lineif (!file.exists(here("data", "TCGA-PANCAN-HiSeq-801x20531", "data.csv"))) {download.file(url ="https://archive.ics.uci.edu/static/public/401/gene+expression+cancer+rna+seq.zip", destfile = here::here("data", "TCGA-PANCAN-HiSeq-801x20531.zip"), mode ="wb")unzip(here::here("data", "TCGA-PANCAN-HiSeq-801x20531.zip"), exdir = here::here("data/TCGA-PANCAN-HiSeq-801x20531/"))# Untar into folderuntar(here::here("data/TCGA-PANCAN-HiSeq-801x20531/TCGA-PANCAN-HiSeq-801x20531.tar.gz"), exdir =here("data"))}tcga <-tibble(read.csv(here("data", "TCGA-PANCAN-HiSeq-801x20531", "data.csv")))tcga_t <-t(as.matrix(tcga[,2:20532]))colnames(tcga_t) <- tcga$Xtcga_t_pc <-prcomp(tcga_t, scale =FALSE)$xggally_hexbin <-function (data, mapping, ...) { p <-ggplot(data = data, mapping = mapping) +geom_hex(binwidth=20, ...) p}ggpairs(tcga_t_pc, columns=c(1:4),lower =list(continuous ="hexbin")) +scale_fill_gradient(trans="log", low="#E24C80", high="#FDF6B5")
Generalized pairs plot
The pairs plot can also incorporate non-numerical variables, and different types of two variable plots.
# Matrix plot when variables are not numericdata(australia_PISA2012)australia_PISA2012 <- australia_PISA2012 |>mutate(across(desk:dishwasher, factor))australia_PISA2012 |>filter(!is.na(dishwasher)) |>ggpairs(columns=c(3, 15, 16, 21, 26))
Generalized Pairs Plots
# Modify the defaults, set the transparency of points since there is a lot of dataaustralia_PISA2012 |>filter(!is.na(dishwasher)) |>ggpairs(columns=c(3, 15, 16, 21, 26), lower =list(continuous =wrap("points", alpha=0.05)))
Customized Generalized Pairs Plots
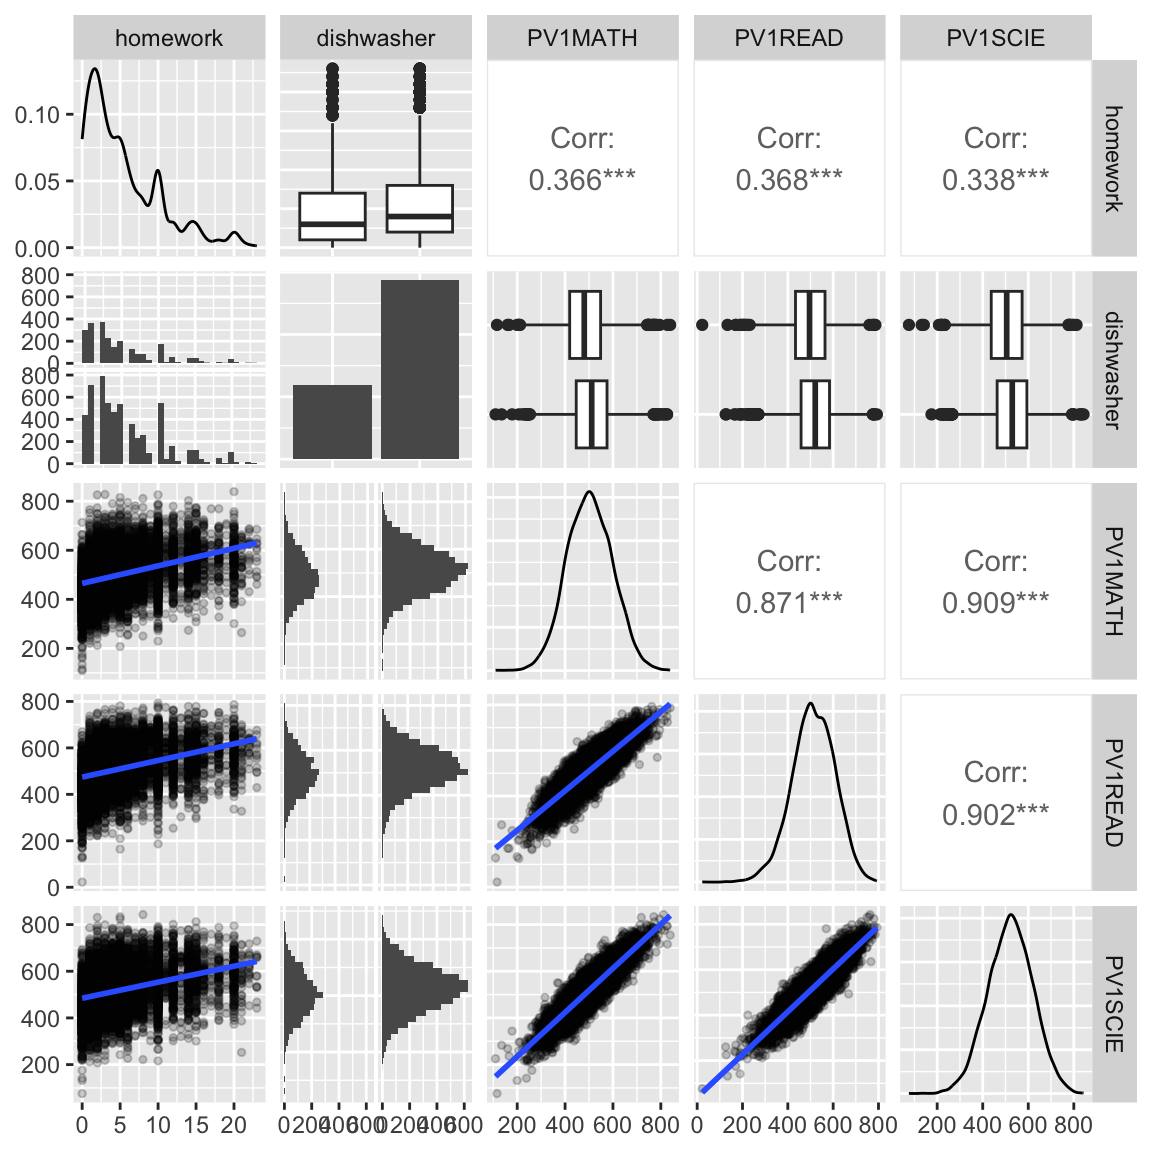
What do we learn?
moderate increase in all scores as more time is spent on homework
test scores all have a very regular bivariate normal shape - is this simulated data? yes.
having a dishwasher in the household corresponds to small increase in homework time
very little but slight increase in scores with a dishwasher in household
Your turn
Re-make the plot with
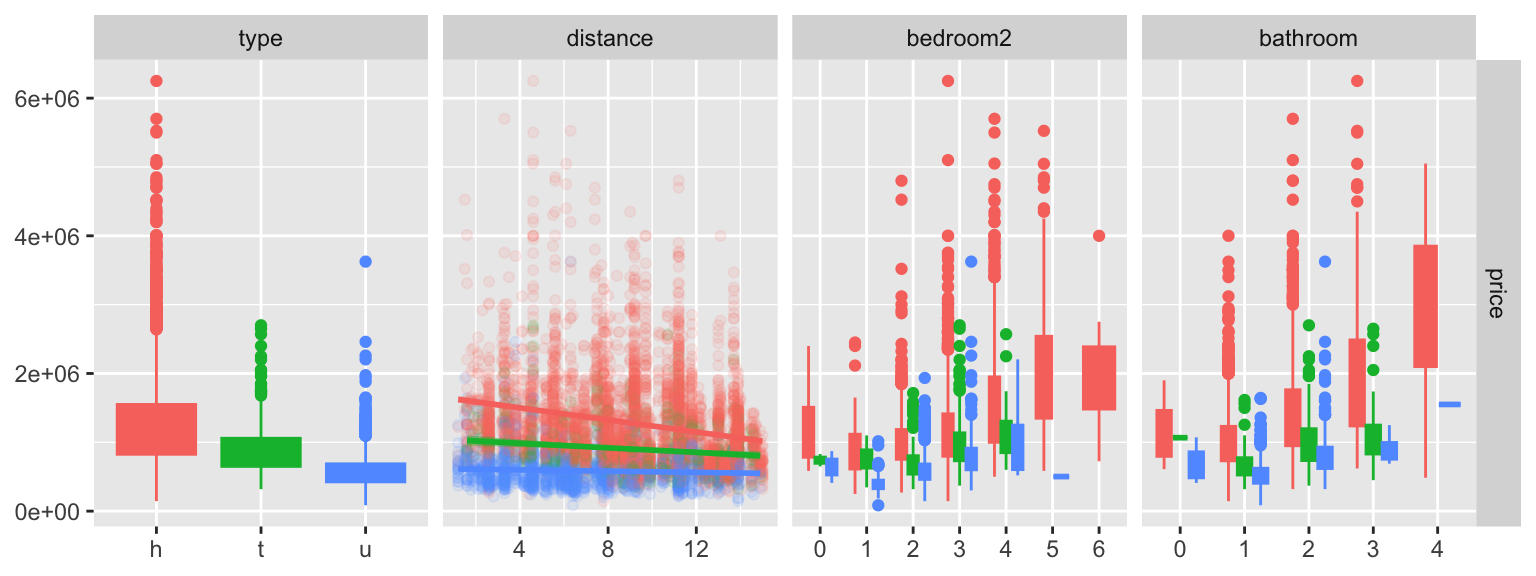
side-by-side boxplots on the lower triangle, for the combo variables,
With large data, aggregate to get an overview, and select some observations to show.
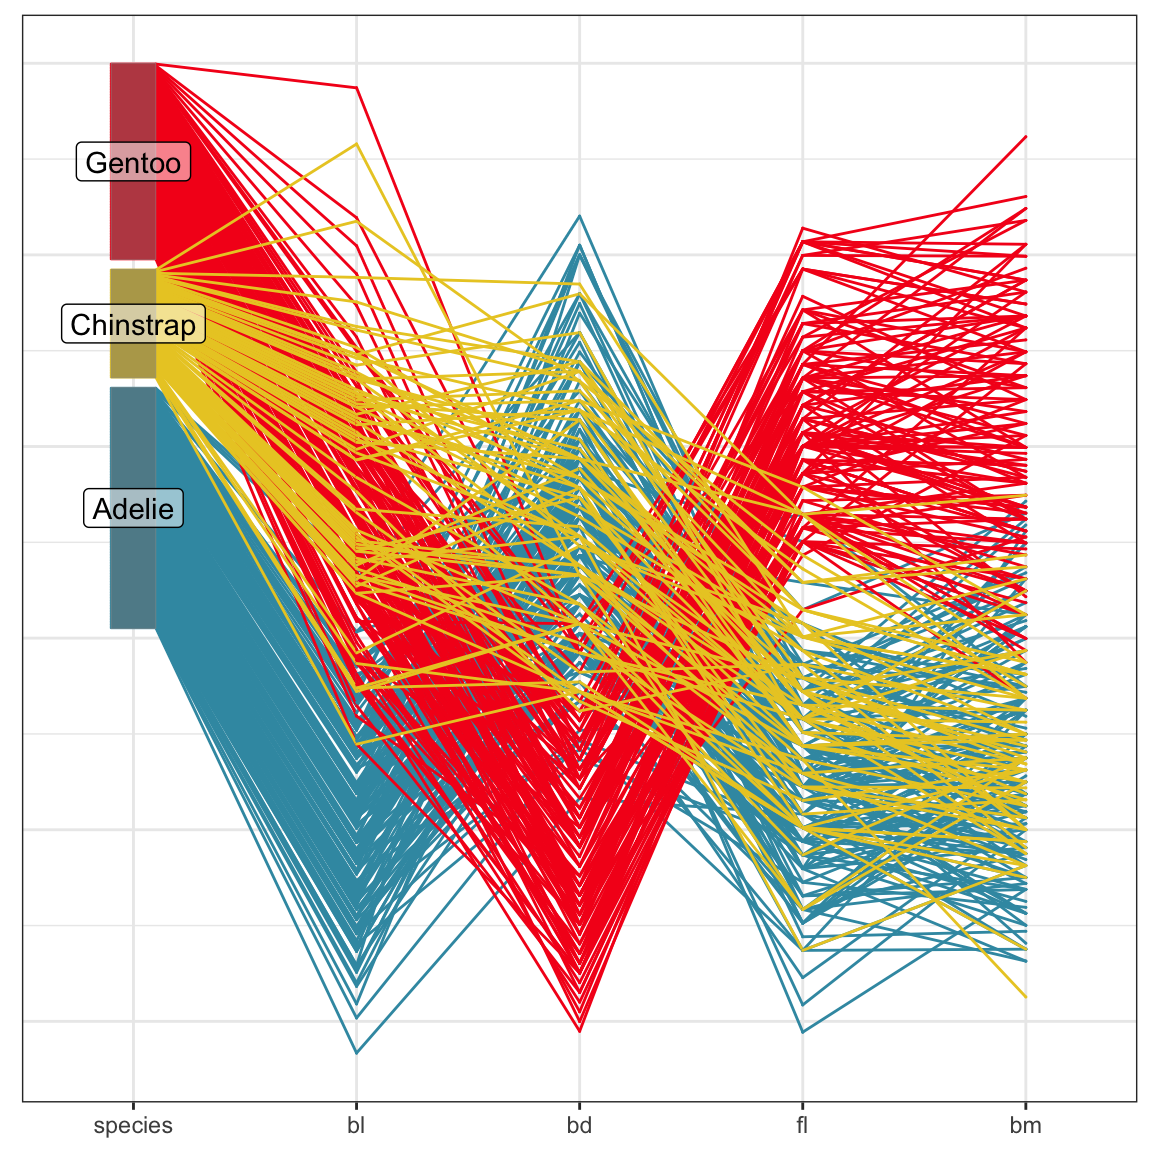
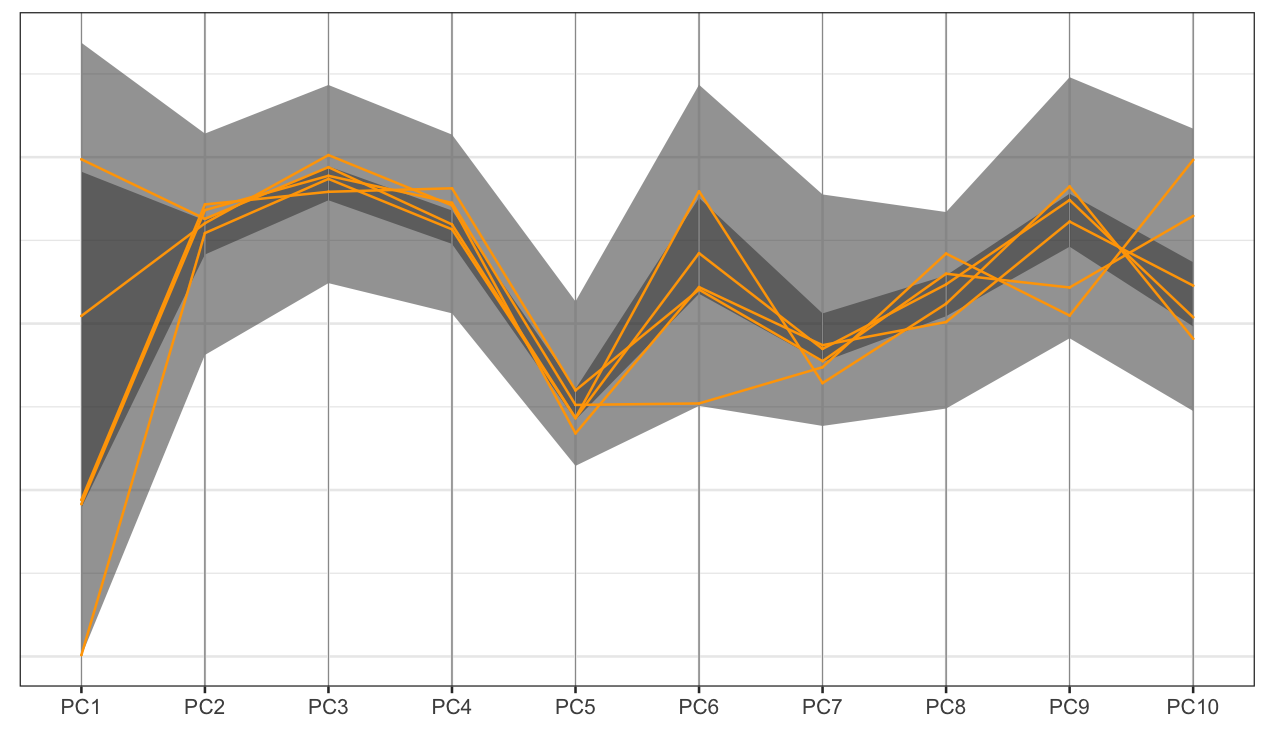
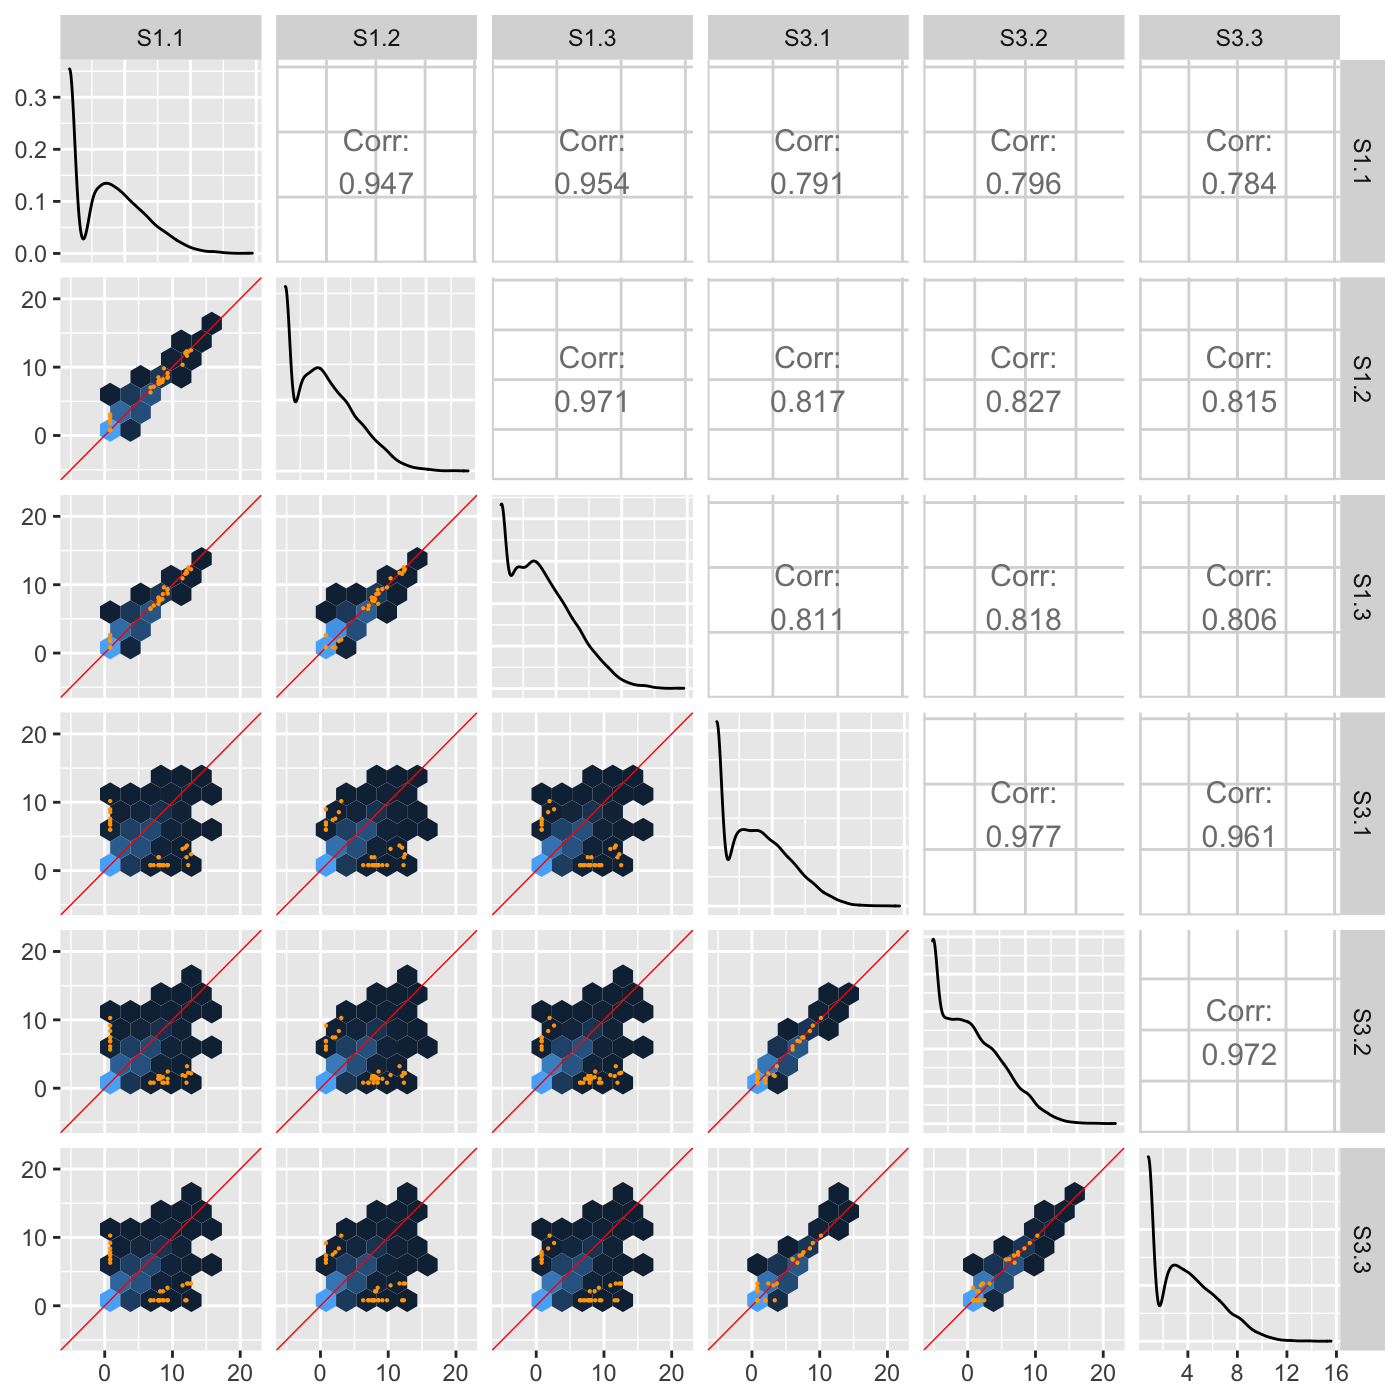
Big biological data
The Bioconductor package bigPint has tools for working with larger amounts of data, as seen in RNA-Seq experiments. It has variations of scatterplot matrices, parallel coordinate plots and interactivity with these displays.