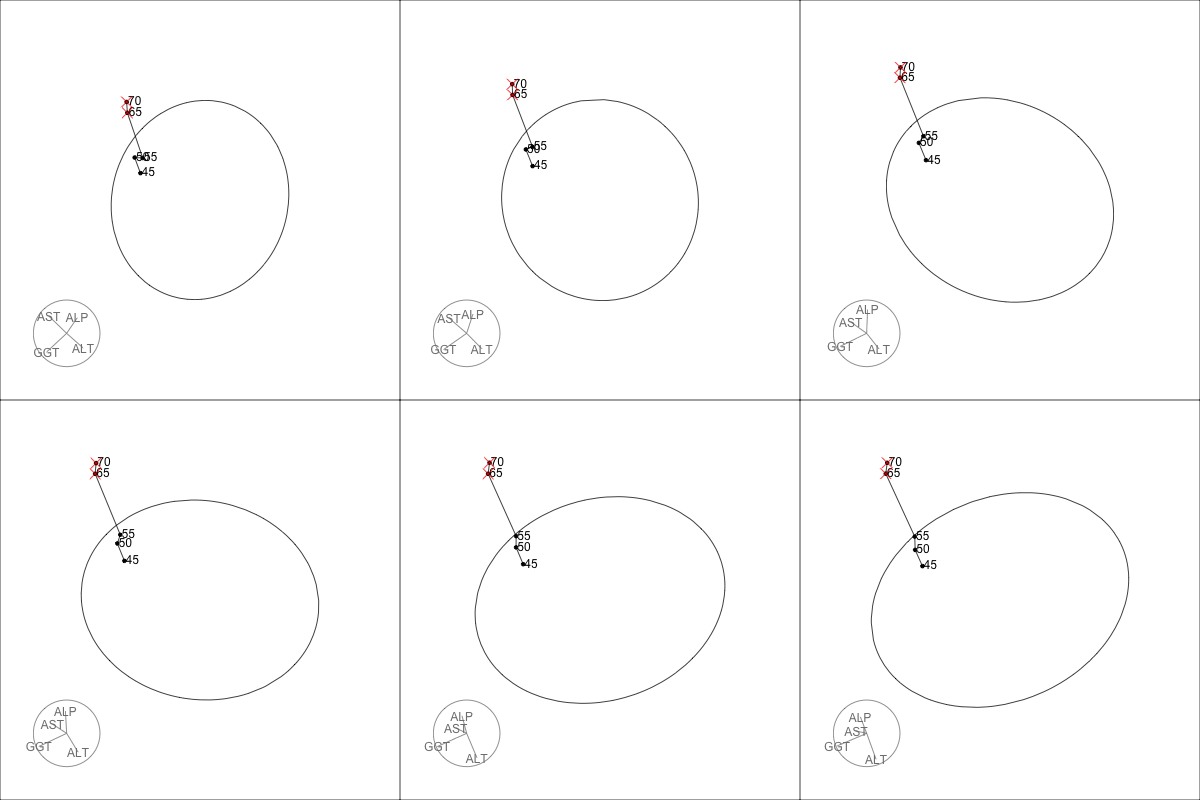
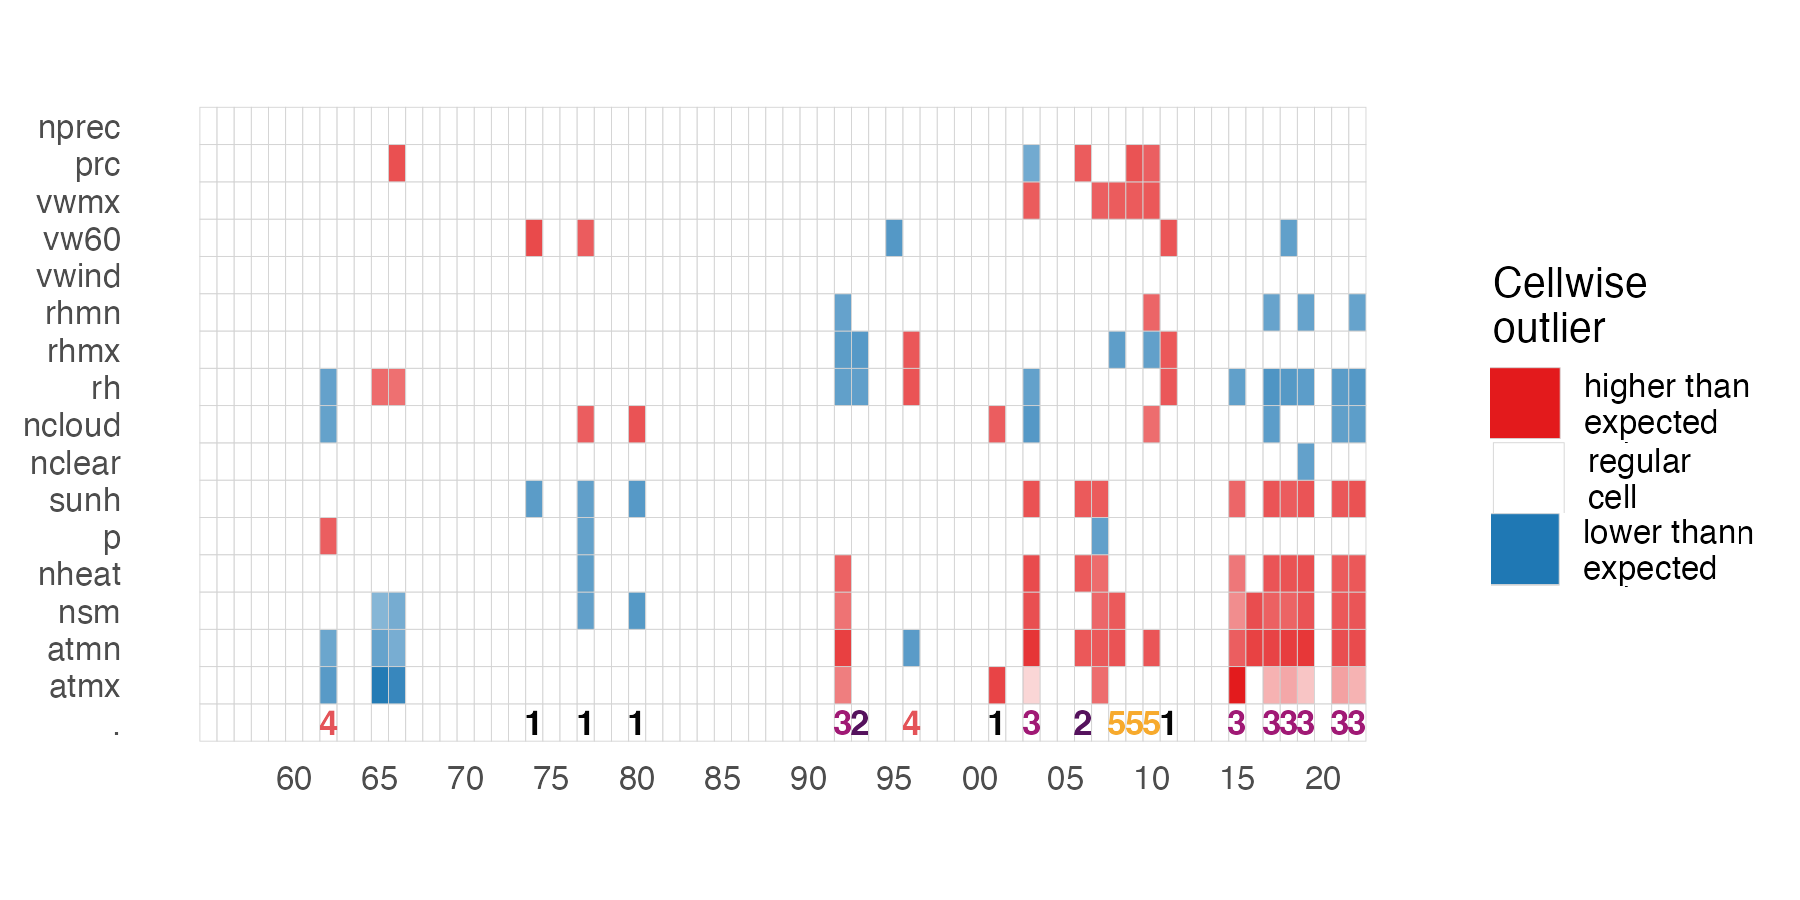
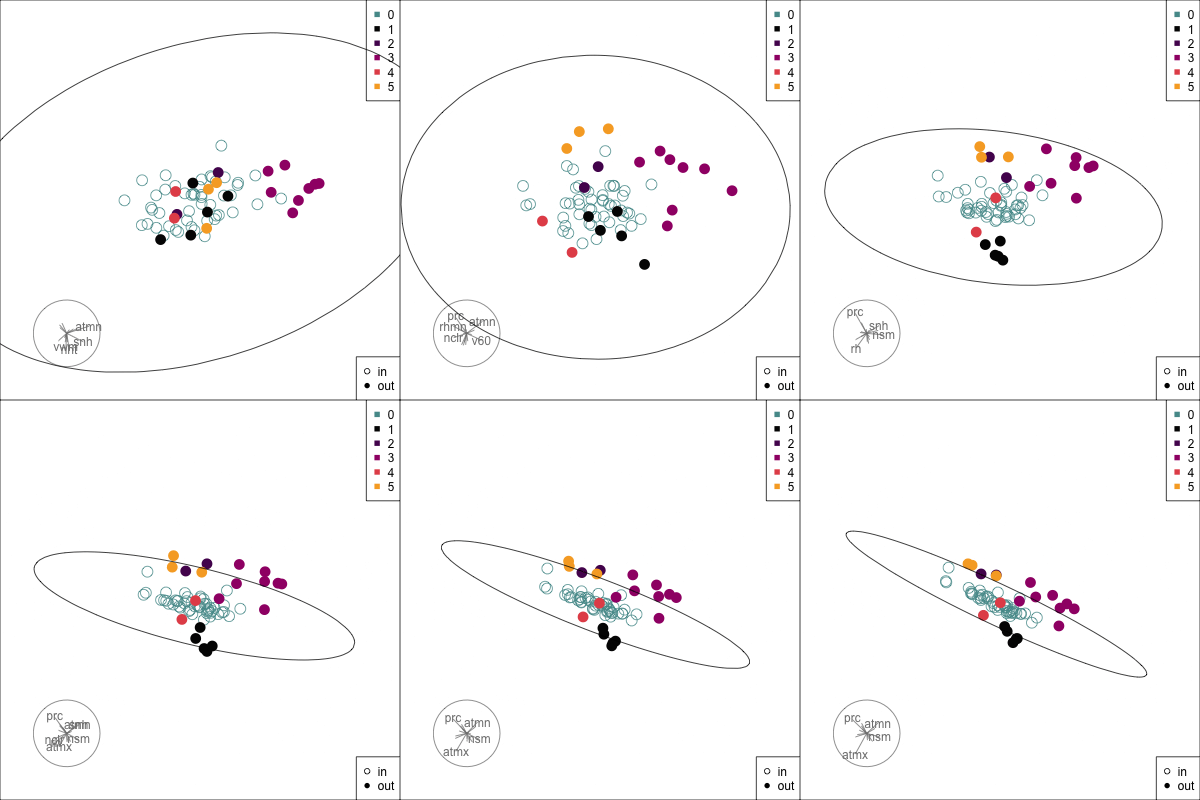
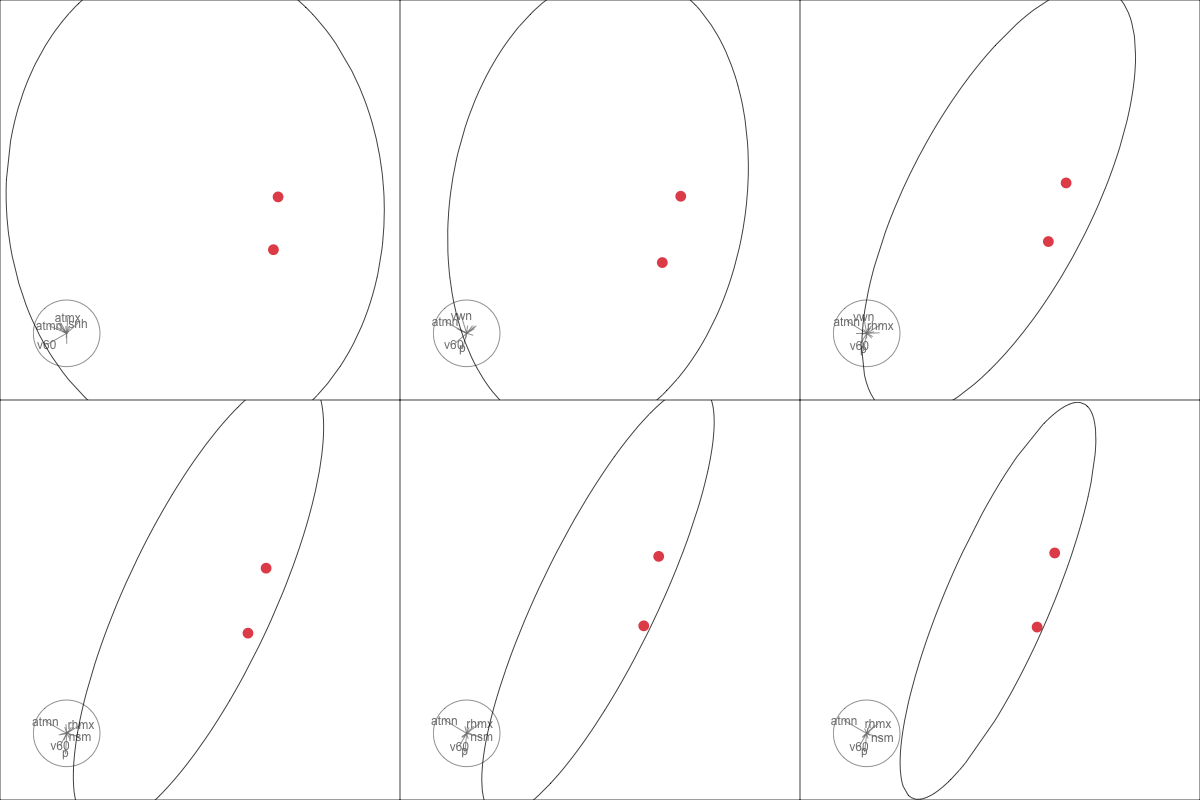
Projection pursuit (PP) defines a quantitative criterion for the interestingness of a projection (a projection pursuit index), and searches the space of possible projections for the most interesting one to display. Principal component analysis can be considered to the a special case of PP.
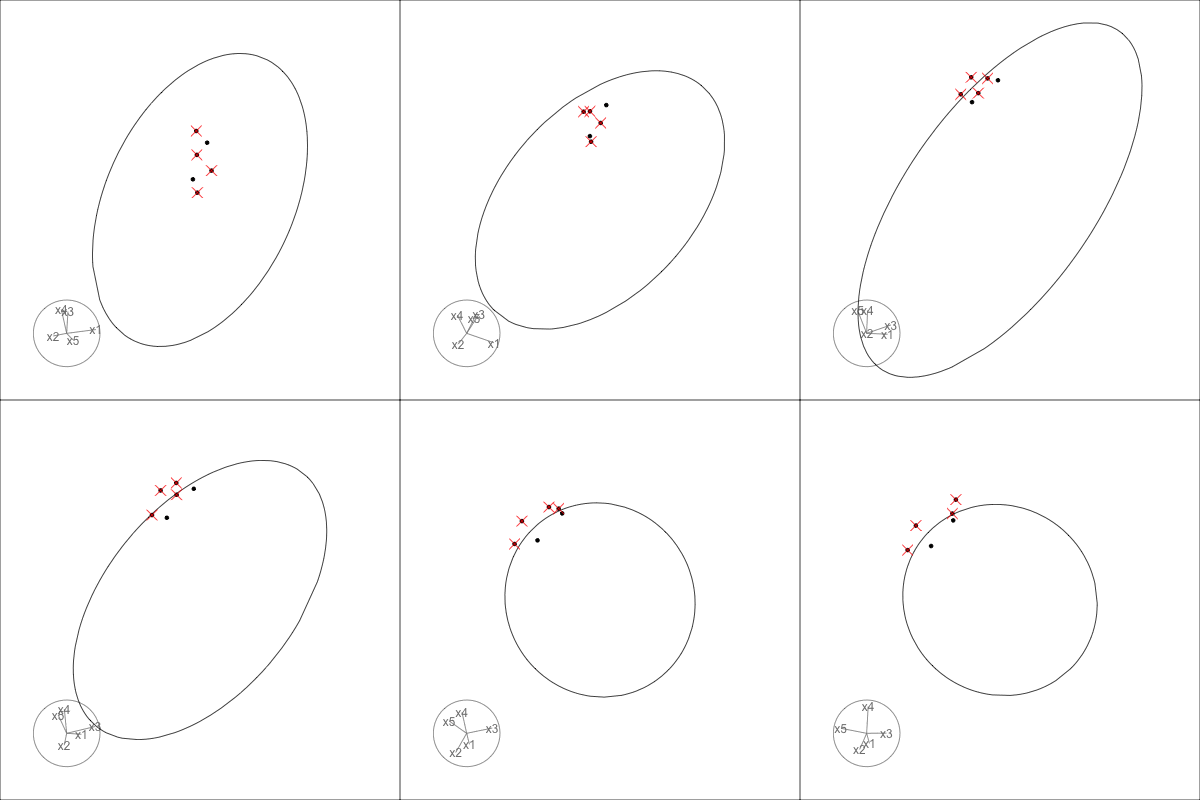
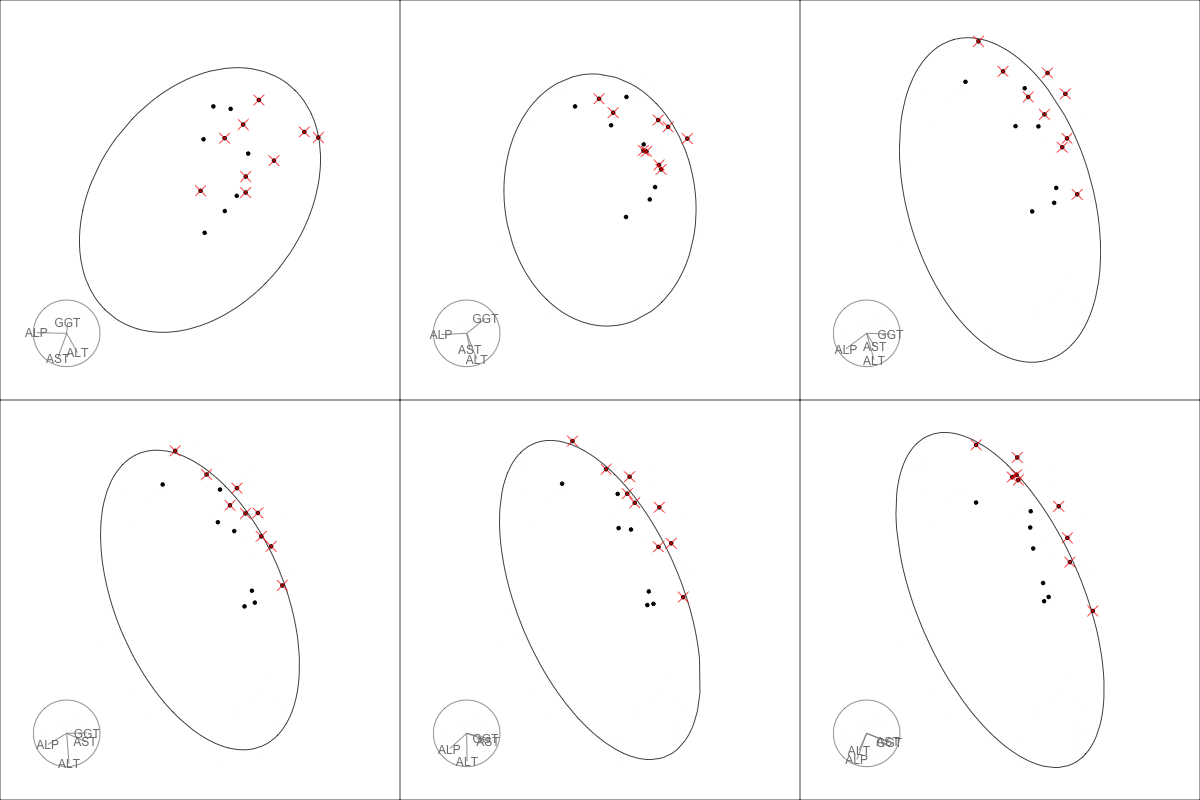
Combining PP with a tour algorithm provides a way to watch the optimisation, and see more projections than just the best. This is called a projection pursuit guided tour.
Ways to make comparisons
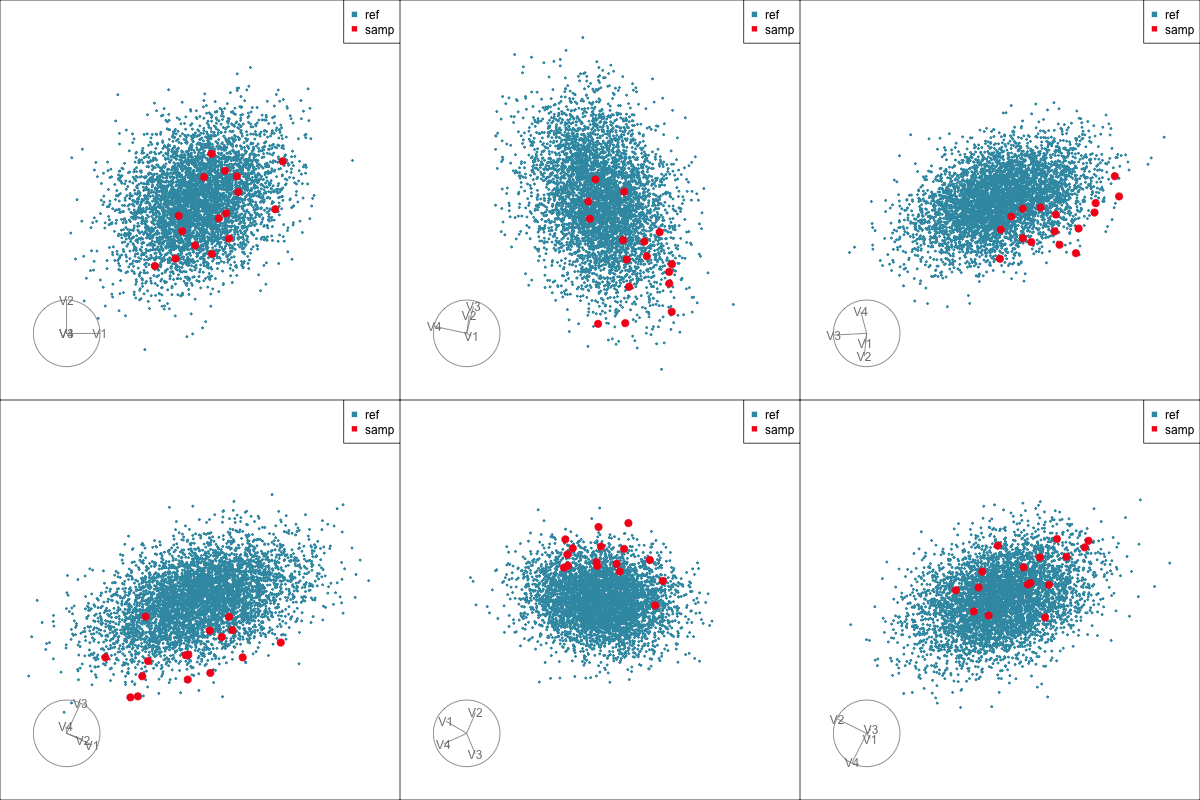
Generate a reference sample (here it is from multivariate normal), and overlay with the new sample.
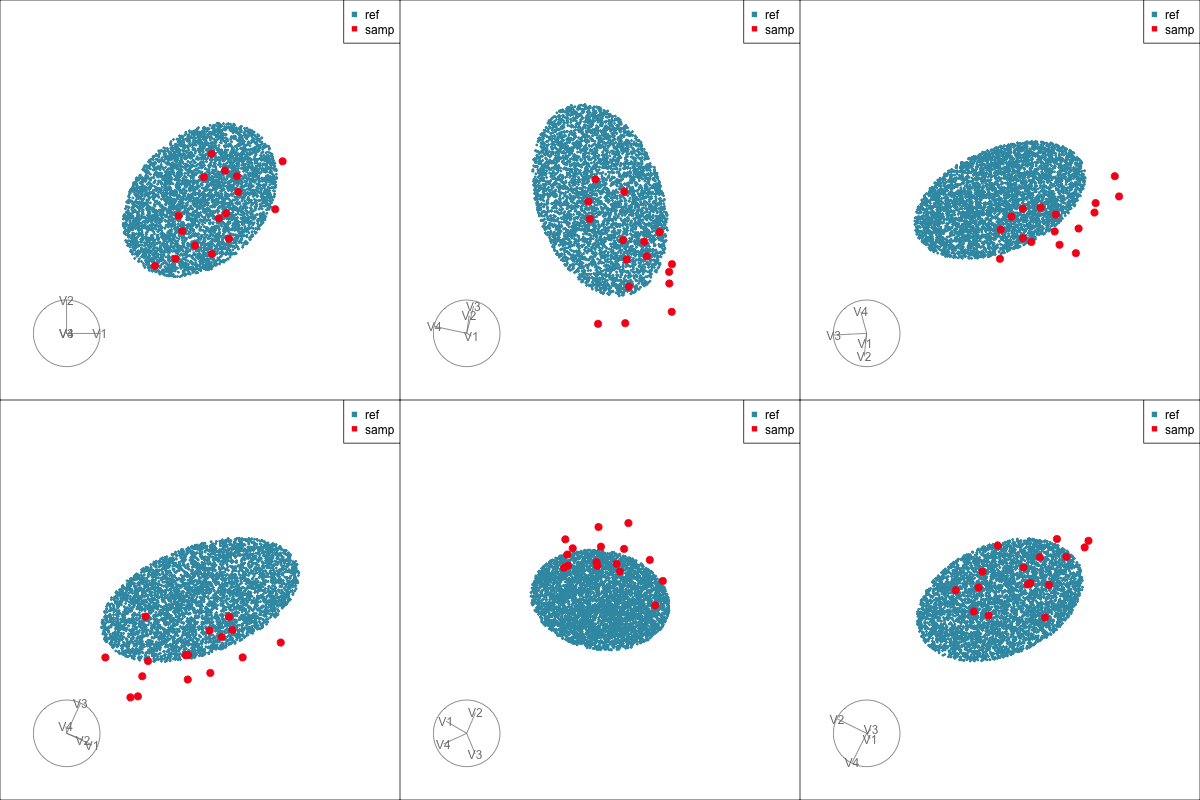
Or, generate a confidence region from the reference distribution (here a ellipse because reference distribution is multivariate normal).
BUT
How do you see that an observation is outside a confidence region, or the subspaces/directions it is outside?
How do you get the optimisation to ignore one of the point sets?
New PP Index
Let indicate a 2D projection basis (). The reference sample is from . Mahalanobis distance measures the distance between an observation and the center using the variance-covariance matrix .
We define the new PP index as
where is the subset of points being compared with the normal.
Drawing ellipses in projections
Let be a vector. A ellipsoid corresponding to a given variance-covariance () and mean vector () is described by the equation
where is a constant that depends on a specific confidence level.
Let be a vector representing a point in , and let denote the projected mean.
The projection of the ellipsoid onto the projection space described by has the equation
How it works
The null being from a normal population is represented in the projection using an ellipse, the projection of the -D confidence ellipse.